
Simple Sims On Pandemic Variance

I’ve said it isn’t crazy to consider cutting pandemic deaths via more infection inequality, including via deliberate exposure. Some have said I’m evil to suggest that, while others have said it just can’t work. In this post, I address those latter doubts, by offering specific sim models wherein variance and deliberate exposure save lives.
Of course, these models can’t prove that we should now adopt such policies. Every model makes specific assumptions that may not be true. The goal here is instead to show that that these ideas aren’t crazy. If they work and make sense in specific plausible situations, then we can’t dismiss them without knowing enough about our actual specific situation.
First, let me point you all to this Javascript sim model done by Zach Hess. He built this at my suggestion, but I haven’t yet learned enough Javascript to figure it all out. (Anyone want to translate it to pseudo-code?) It distinguishes 6 disease states: never-sick, exposed, recovered, asymptomatic sick, symptomatic sick, and in-intensive-care, and 3 kinds of workers: medical, critical, and general. It allows people to be put into quarantine.
I think, but am not sure, that this model enforces a constraint on the total number of people who can fit into quarantine, and that having more available critical and medical workers makes sick folks less likely to die. Zack finds, for his default parameter values, that deliberately exposing & quarantining critical and medical workers early ends up saving lives. I presume he’s right.
Over the last few days, I put together this simple spreadsheet model. (Feel free to copy, change, etc.) It doesn’t distinguish critical vs. medical vs. general workers, and so doesn’t capture gains from treating those differently. My baseline model starts with one contagious person in a US-sized population of 327M uninfected.
After 7 days each contagious person becomes visibly sick, 10% of these sick need an average of 7 ICU days of help, and after 7 days some fraction of sick folks die, while the rest recover and become immune. Sick folks are added onto the usual 10K people who need ICU help each day, and their death rate goes as the logarithm of the daily total number of people who need ICU help. If only 10K people total need ICU help, only 0.4% of sick folks die, but if 50K per day people need ICU help, then 3% of them die.
The number of infected people who become contagious each day is proportional to the product of the uninfected count times the contagious count. Except that there is a quarantine that always holds 10M people, with a proportion of contagious vs. uninfected the same as the larger population. People in quarantine have only 2% of the usual rate of infecting others. The infection rate parameter is set so that, early on, the death so far count doubles about every 6 days.
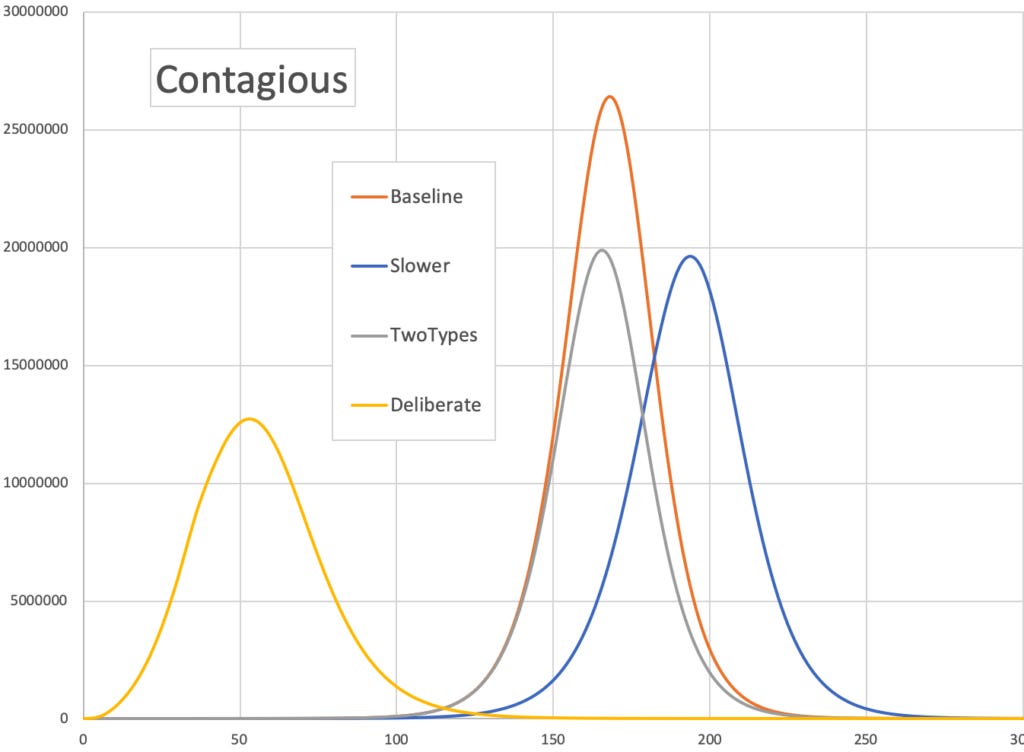
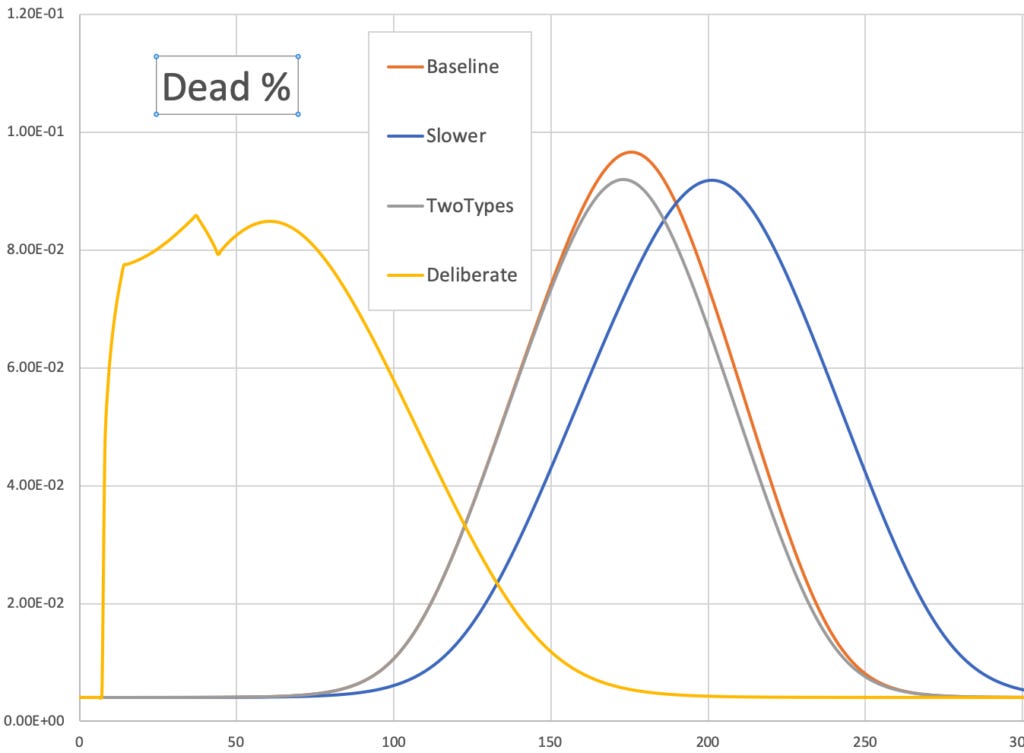
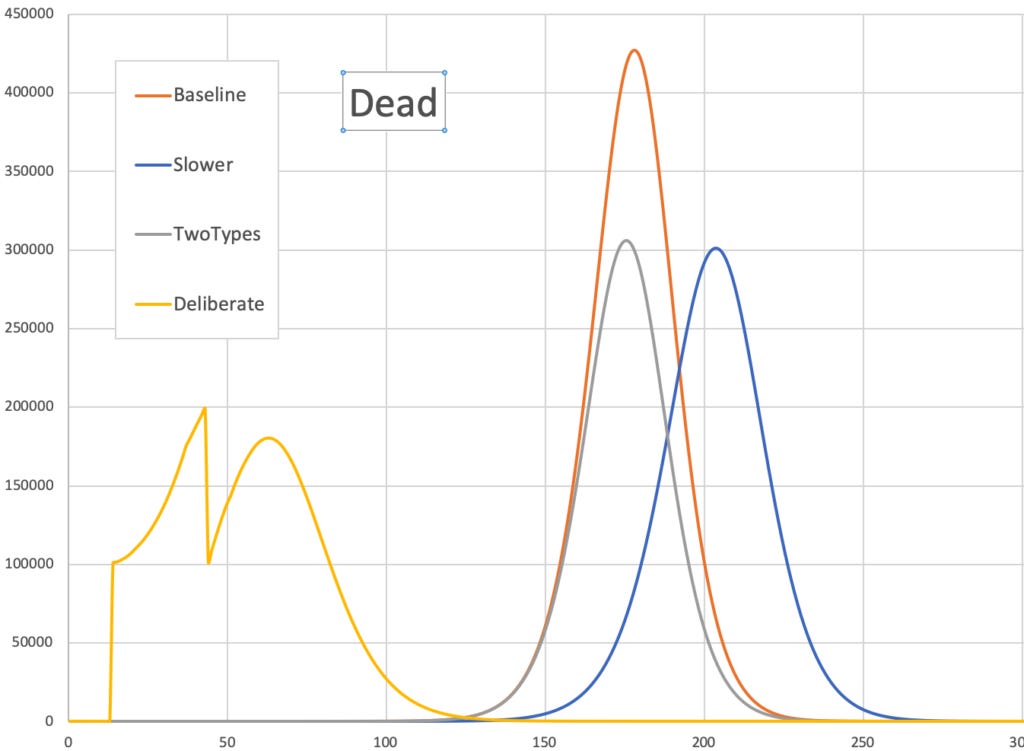
In that baseline mode, 14.3M people die within a year. The number of contagious peaks on day 168 and daily deaths peak on day 177, when 9.7% of sick folks die. I compare that baseline model with three variations.
Here, the infection rate is cut uniformly by 5%, from 1.0 to 0.95. As a result, 11.9M people die, with 16% fewer deaths than baseline. Contagious and deaths peak on days 195 and 205, and the peak death % is 9.2%.
Here, instead of having one uniform population all with the same infection constant of 1.0, they are split into two initially equal-sized types, for whom these constants are 0.6 and 1.4. So while they together initially produce the same number of infected, one type gets infected 2.3 times as easily as the other type. In this variation, 10.4M people die, with 27% fewer deaths than baseline. Contagion and deaths peak on days 167 and 175, when the peak death % is 9.2%.
Here, for the first 30 days 1.3M people per day are deliberately infected and then immediately placed into quarantine for 7 days until they get sick. They displace random people who would otherwise have been in quarantine. In this variation, 11.3M die, with 21% fewer deaths than baseline. The contagious count peaks on day 53, and deaths on day 40, when the death rate is 8.5%.
These simple models show that, to cut deaths, deliberate exposure can make sense, as can ways to cut infection rates and increase variance in who is more vs. less easily infected. For more details, these 3 graphs show # contagious, death % of sick, and # newly dead, all vs. days:
Of course there might be bugs in my spreadsheet; please do point them out.
Added 8am: Let me also note that in such simple models it does not help society to deliberately infect yourself, if once infected your chance of infecting others is the same as that of an average person who was infected accidentally. In that case you just pull all the curves forward in time a bit, and by increasing the rate of new sick folks slightly you increase their death rate slightly, and thus increase total deaths.
Added 09Mar: I found a small error in my spreadsheet, and so replaced the numbers and graphs above with corrected versions.
Added 17Mar: See more sims where select old or young to for deliberate exposure here.
Ok and apparently the worries about inacurrate reporting are overblown.
It's not unthinkable, although I struggle to name an agent acting this way. It should go dormant like a chickenpox, but somehow be able to trick the immune system into losing track of it.
What I meant is that they are infected again in case of re-exposure, being in contact with a carrier of a pathogen. Just as in case of flu.
I think I see where you're going with this question, a fixed chance of reinfection within a certain time range is by no means the best way to model it, but perhaps it can be used as an approximation.