Disagreement on Disagreement
I’m seriously considering returning to the topic of disagreement in one of my next two books. So I’ve been reviewing literatures, and I just tried some polls. For example:
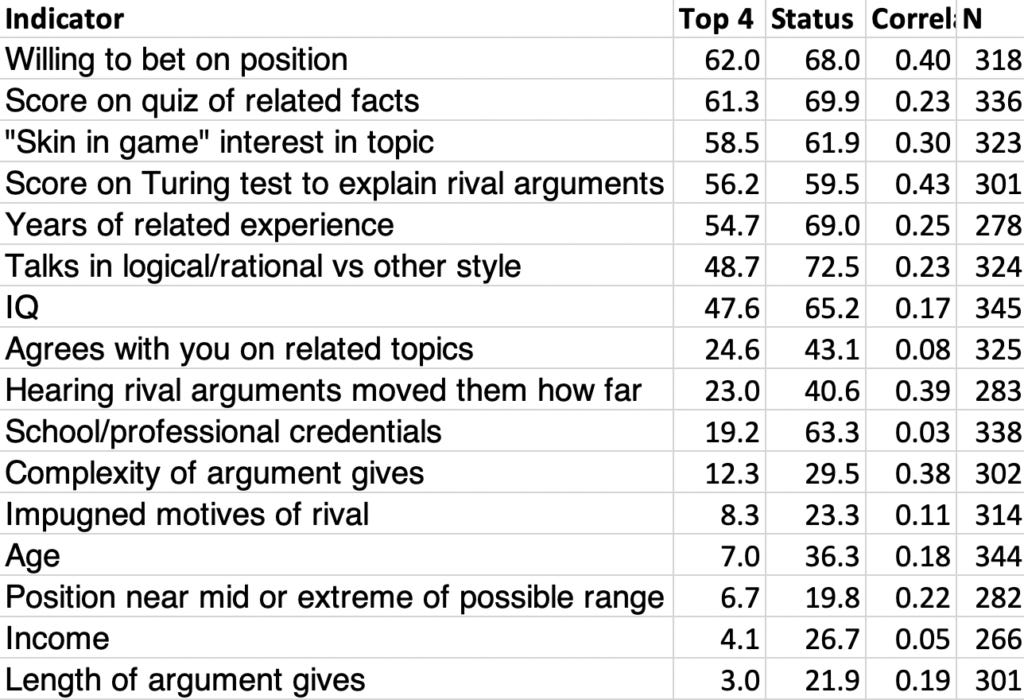
These results surprised me. Experience I can understand, but why are IQ and credentials so low, especially relative to conversation style? And why is this so different from the cues that media, academia, and government use to decide who to believe?
To dig further, I expanded my search. I collected 16 indicators, and asked people to pick their top 4 out of these, and also for each to say “if it tends to make you look better than rivals when you disagree.” I had intended this last question to be about if you personally tend to look better by that criteria, but I think most people just read it as asking if that indicator is especially potent in setting your perceived status in the context of a disagreement.
Here are the 16 indicators, sorted by the 2nd column, which gives % who say that indicator is in their top 4. (The average of this top 4 % is almost exactly 5/16, so these are actually stats on the top 5 indicators.)
The top 5 items on this list are all chosen by 55-62% of subjects, a pretty narrow % range, and the next 2 are each chosen by 48%. We thus see quite a wide range of opinion on what are the best indicators to judge who is right in a disagreement. The top 7 of the 16 indicators tried are similarly popular, and for each one 37-52% of subjects did not put it in their personal top 5 indicators. This suggests trying future polls with an even larger sets of candidate indicators, where we may see even wider preference variation.
The most popular indicators here seem quite different from what media, academia, and government use to decide who to believe in the context of disagreements. And if these poll participants were representative and honest about what actually persuades them, then these results suggest that speakers should adopt quite different strategies if their priority is to persuade audiences. Instead of collecting formal credentials, adopting middle-of-road positions, impugning rival motives, and offering long complex arguments, advocates should instead offer bets, adopt rational talking styles and take many tests, such as on IQ, related facts, and rival arguments.
More likely, not only do these poll respondents differ from the general population, they probably aren’t being honest about, or just don’t know, what actually persuades them. We might explore these issues via new wider polls that present vignettes of disagreements, and then ask people to pick sides. (Let me know if you’d like to work on that with me.)
The other 3 columns in the table above show the % who say an indicator gives status, the correlation across subjects between status and top 4 choices, and the number of respondents for each indicator. The overall correlation across indicators between the top 5 and status columns is 0.90. The obvious interpretation of these results is that status is closely related to persuasiveness. Whatever indicators people say persuades them, they also say give status.


Yeah, yeah, I know :)
I'd wager you have at least a few Talebian types amongst your followers who are allergic to the notion of IQ. If you'd had intelligence or intellect instead perhaps it would have scored higher as a category?